
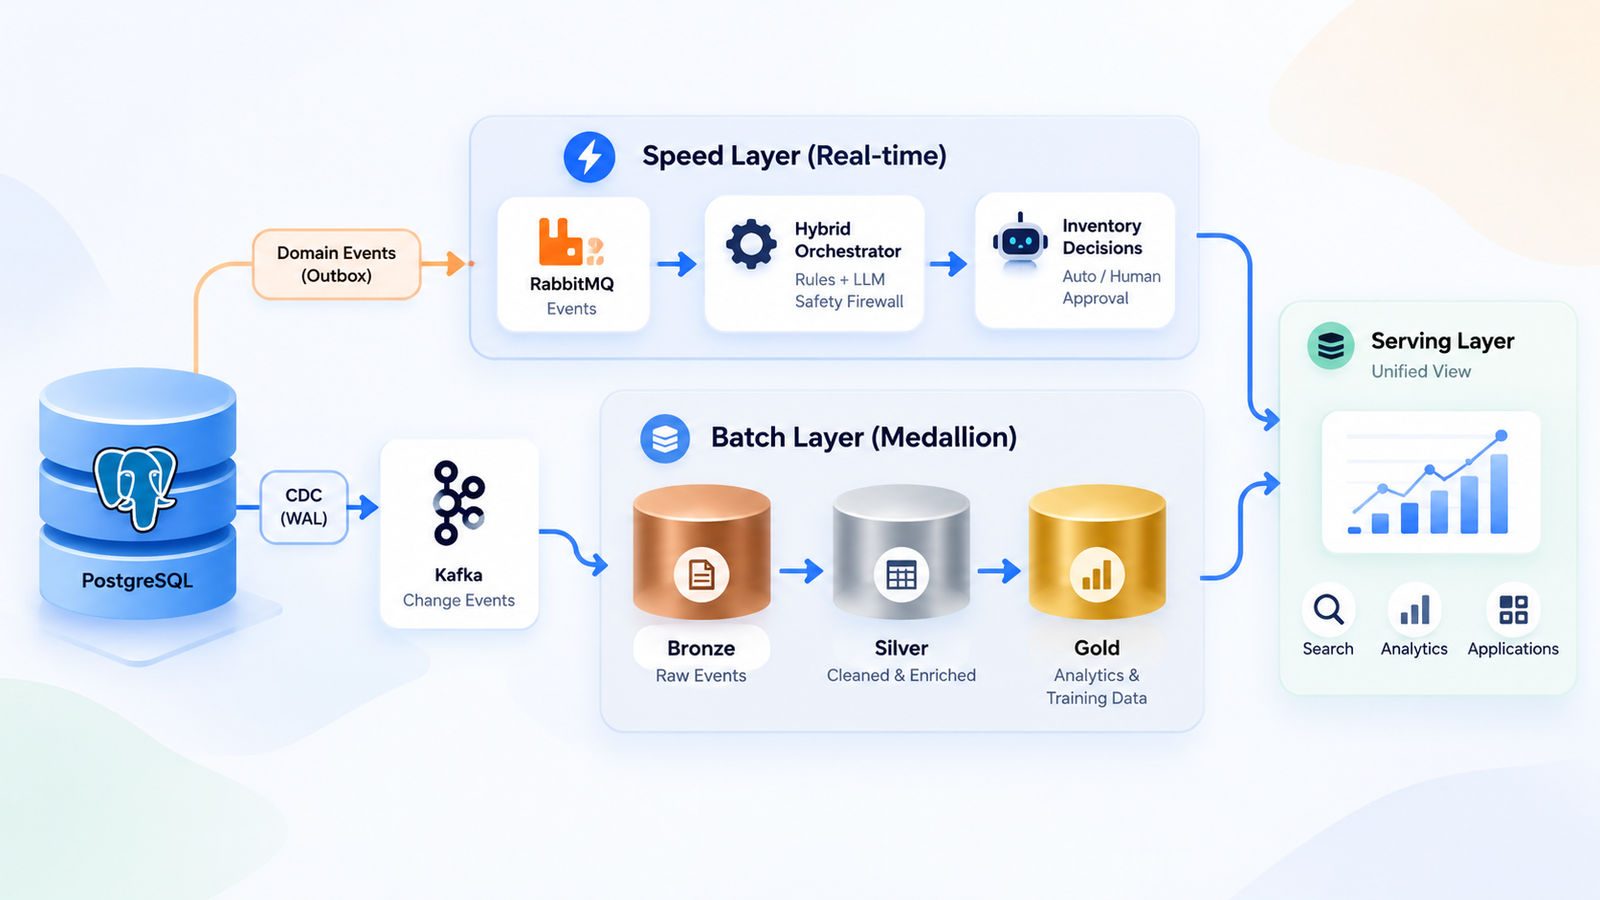
We didn’t set out to build a Lambda architecture. We were solving two specific problems. Our event stream didn’t reliably match what we’d committed to the database, and our autonomous decision-maker needed hard limits instead of good intentions. What we ended up with is close enough to Lambda architecture that we borrowed the name. It’s a real-time speed layer that feeds decisions, backed by a CDC-fed batch layer that we organize into Bronze, Silver, and Gold stages. We call the combination the Lambda-Medallion architecture. That’s our own label for this design, not an established industry term.
A lot of “real-time” systems don’t actually solve the starting problem here. Firing an event from application code doesn’t guarantee that the event matches what the database committed. Once you need that guarantee, you’re building something like Lambda architecture whether you set out to or not.
The dual-write problem
Say your HTTP handler updates PostgreSQL and then calls kafka_producer.send() in the same request. That’s a dual write. If the network times out between the DB commit and the broker ack, Postgres keeps the write. Kafka never gets the event. Reverse the order and publish before the transaction commits. If a rollback follows, it leaves an event on the broker for something that never happened in the database.
Retries don’t fix this on their own. Two independent systems that update outside a two-phase commit aren’t atomic, so there’s always a window where they can disagree.
Two patterns that address it
Two patterns address this reliably, and they solve different problems:
- Transactional Outbox — write your business row and an event row in the same ACID transaction. A background process then forwards the outbox table to Kafka. This fits when the event needs to carry business meaning —
OrderCancelledDueToPaymentFailurerather thanstatus = 4. - Log-based CDC — tail the database’s own transaction log (Postgres WAL, MySQL binlog) and derive events directly from committed rows. Application code doesn’t own event emission here. This fits when you’re replicating table state into an analytical store and don’t need domain-level event semantics.
We use both, for different parts of the system. That split produces the two halves of the architecture we describe below.
Lambda architecture, and the merge step most descriptions leave out
Lambda architecture (Nathan Marz, ~2011) has three pieces. A batch layer that’s slow but correct, a speed layer that’s fast but approximate, and a serving layer where the two merge. Most write-ups describe the three layers and stop there. The merge step is how the batch layer’s output feeds back into what the speed layer does. We found this the most important part to get right, so that’s what we describe in detail below.
Our speed layer: decide now, correct later
Our speed layer is a service we call hybrid-orchestrator. It consumes OrderStockConfirmedIntegrationEvent off RabbitMQ rather than Kafka. RabbitMQ gives us per-message ack/nack and dead-letter queues, which fits a competing-consumer work queue feeding a human approval desk. Kafka gives you a replayable log with per-partition ordering and offset retention, which fits training and backfilling Parquet, but it doesn’t order events across partitions and isn’t built around per-message ack/nack. We use both brokers for what they’re actually suited to.
Inside the speed layer:
- A trigger filter makes a routing decision in microseconds — nothing else. Healthy stock fast-paths straight to an ack. Low stock or a demand spike escalates. In our load test, 80.0% of events fast-pathed and 20.0% escalated, and the fast path cleared at a measured P50 of 4.0 µs.
- Escalated events pass through a token-bucket rate limiter in front of the LLM call. While an event waits for budget, we leave its AMQP delivery unacknowledged. Combined with a bounded
basic_qosprefetch count, the channel stops receiving new deliveries once the number of outstanding unacknowledged messages hits that limit. That gives us backpressure into RabbitMQ without an explicit queue-depth check in application code. - Only escalated events pay for a multi-turn LLM tool-calling loop. It queries real-time demand features, forecasts, festival calendars, and supplier disruption signals before proposing a quantity.
- Every proposal hits a deterministic safety firewall before a human ever sees it. We clamp it to
max_stock - on_hand, clamp it to a budget ceiling, and ifon_handis at or below zero, we force the risk level up so it can never auto-approve. The LLM explains. It does not authorize.
This is the design decision we’d defend most directly. A model’s stated reasoning doesn’t function as a safety check, because a confident-sounding explanation and a correct decision aren’t the same claim, and prompting doesn’t close that gap reliably. The safety firewall exists specifically so we don’t have to rely on the model getting it right. It enforces fixed bounds regardless of what was proposed or how it was justified.
Our batch layer: Bronze, Silver, and Gold as a trust gradient
The batch half starts from the CDC stream: Postgres → wal_level = logical → a pgoutput publication → Debezium → Kafka → our own consumer writing into a three-stage lakehouse.
- Bronze is raw Kafka dumps, nothing validated, partitioned
date=YYYY-MM-DD/hour=HH/, one file per(topic, partition, offset). On a local or POSIX-compliant filesystem, files land via write-to-.tmp-then-rename. That rename is atomic on the same filesystem, so a reader never sees a half-written Parquet file. Replaying the same offset overwrites the file instead of creating a duplicate. That mechanism assumes a POSIX filesystem. Object storage backends such as S3 or GCS don’t guarantee atomic rename, so they need a different publication approach — a content- or offset-derived object key, or a manifest/commit-marker pattern. - Silver turns that raw shape into typed, schema-checked
SilverInventoryEventrecords —sku_id,movement_type,on_hand, all cast and validated. We keep the CDC operation type (CREATE/UPDATE/DELETE/tombstone) as a first-class field instead of inferring it later. - Gold rolls Silver up into daily demand aggregates per SKU-location — units sold, movement count, by weekday.
That’s the Medallion pattern. The distinction we actually care about isn’t the storage format. Medallion isn’t a storage format, it’s a trust gradient. Bronze preserves the raw data. Silver is where row shape and types become something you can rely on. Gold is where the aggregated numbers become something you can rely on. Skipping straight to a single “clean” table removes the staging, not the underlying question of whether you trust the data at each point.
Where the two layers connect
Most Lambda architecture diagrams reduce this step to a single arrow into a serving layer. We use our Gold daily-demand output to warm the speed layer’s OnlineDemandModel instead of cold-starting it. A new SKU-location pair doesn’t start from an arbitrary initial guess — it starts from whatever Gold has already computed for that demand pattern.
That feedback path is what actually connects the batch and speed layers. It’s also what makes this a Lambda-Medallion architecture instead of two systems that just happen to share a database. Without something like it, the two layers can run independently and never really inform each other, even when they’re built on the same underlying data.
On the serving side, our analytical warehouse is ClickHouse, using ReplacingMergeTree(version). ReplacingMergeTree does not deduplicate on insert. Deduplication happens during background merges, which run asynchronously and can take a while depending on part sizes and merge scheduling. A plain SELECT against the table can return multiple rows for the same key if a merge hasn’t run yet. That’s documented behavior, not a bug. At query time there are two common ways to handle it. SELECT ... FINAL forces a merge at read time, which is more expensive. Aggregating with argMax(column, version) is faster, and it’s what we use for anything dashboard-facing.
CDC operational costs that are easy to underestimate
Debezium’s JSON payload format is well documented. The operational failure modes around replication slots get less coverage, and they’re worth understanding before you run this in production.
REPLICA IDENTITY FULL and WAL volume
REPLICA IDENTITY FULL has a real I/O cost. By default, Postgres only logs primary-key columns for UPDATE/DELETE rows in the WAL. Suppose a downstream consumer needs to check the previous value of a column — for example, whether a status was actually PENDING before it changed. You need:
sql
ALTER TABLE orders REPLICA IDENTITY FULL;This setting makes Postgres write the entire row image into the WAL on every update, not just the changed columns. On a wide table with high update volume, that’s a meaningful increase in WAL volume, disk I/O, and replication bandwidth. We enable it selectively, on the specific tables that need before/after comparisons, rather than as a default.
Replication slot retention and disk exhaustion
Postgres retains WAL segments on disk back to the oldest restart_lsn among all replication slots, whether or not that slot’s connector is currently connected. An inactive slot — for example, one that a crashed or disconnected connector left behind — still pins WAL at its last recorded position. Postgres has no way to know whether the connector will reconnect and continue from there, so it keeps the WAL just in case.
Suppose a Debezium connector goes into a crash loop and stops advancing its slot’s confirmed_flush_lsn. If max_slot_wal_keep_size is still at its default of -1 (unlimited retention), WAL for that slot keeps accumulating. It can eventually exhaust disk space on the host and force Postgres into an emergency, storage-constrained state. Setting a cap turns that into a contained, recoverable failure instead:
ini
max_slot_wal_keep_size = 102400 # 100 GB cap — Postgres invalidates the slot rather than retaining WAL indefinitelyMonitoring replication slots
Monitoring slot status directly is straightforward, and it’s worth doing from day one:
sql
SELECT slot_name, active, wal_status,
       pg_wal_lsn_diff(pg_current_wal_lsn(), restart_lsn) AS retained_bytes
FROM pg_replication_slots;
If wal_status shows lost, Postgres has already removed the required WAL, and the connector can’t resume from its previous position. Recovery means dropping the slot, recreating it, and re-snapshotting the affected tables. We keep that recovery procedure documented ahead of time instead of working it out during an incident.
Benchmark results
Our synthetic load test measured 165,293 events/sec platform ingestion throughput. It also measured a P50 latency of 4.0 µs and 7.83 KB of process RSS per SKU-location pair. Projected to 1,000,000 pairs, that’s roughly 7.47 GB, which fits inside a 16 GB host with headroom to spare.
Benchmark environment
- CPU: [CPU MODEL]
- RAM: [RAM AMOUNT]
- OS: [OS / KERNEL VERSION]
- Rust version: [RUSTC VERSION]
- Build mode: [DEBUG OR RELEASE — assumed release, not confirmed in source material]
- Concurrency: [NUMBER OF WORKER THREADS / TASKS]
- Event payload: 50,000 unique SKU-location events across 5 fulfillment centers, including duplicate redeliveries and festive-style demand bursts
- Duration: [BENCHMARK DURATION]
- Scope: in-process only. We ran this with
LLM_PROVIDER=disabled, so the numbers reflect Rust-side ingestion (DashMap state, the trigger filter, dedup rings) and exclude LLM network latency
We measured these numbers with LLM_PROVIDER=disabled, specifically to separate Rust-side platform performance from LLM network latency. End-to-end throughput for events that escalate to the LLM path depends instead on the provider’s token-per-minute budget. The rate limiter is tier-agnostic, so moving from an 8,000 TPM free tier to a 500,000+ TPM paid tier is a configuration change, not a code change. A benchmark number is only meaningful alongside the part of the system that produced it, which is why we include the breakdown above.
When this pattern isn’t the right fit
If a multi-hour delay is acceptable for the use case — which covers most reporting pipelines — a scheduled batch ETL job is a reasonable choice. It isn’t a lesser one. Streaming infrastructure carries an ongoing operational cost: replication slots, connector uptime, broker capacity planning. You pay that cost every day, whether or not anyone consumes the data in real time. Reach for this combined speed-layer-plus-CDC-batch-layer approach when the speed layer’s output changes what a human or an agent does immediately. Don’t default to it just because streaming sounds like the more current architecture.
FAQ
Is “Lambda-Medallion architecture” a standard industry term?
No. It’s the term we use in this post to describe our own combination of a real-time speed layer and a CDC-fed Bronze/Silver/Gold batch layer. Lambda architecture and Medallion architecture are each documented elsewhere on their own. We haven’t found a standard name for using them together this way, so we picked one for clarity.
Isn’t Lambda architecture dead? I thought everyone moved to Kappa.
Kappa is a reasonable fit when the stream itself is the single source of truth. It also works when replaying the full log is an acceptable way to fix a bad output. It’s a harder fit once the speed layer’s output needs periodic, more thorough correction — in our case, warming a demand model from a proper daily aggregate rather than a rolling window’s estimate. That’s a job for a batch layer that’s allowed to be slower and more careful. We didn’t choose Lambda over Kappa as a general principle. We chose it because our speed layer needed a teacher.
Why two message brokers? Isn’t that just added operational surface area?
RabbitMQ and Kafka serve different requirements here. RabbitMQ gives us per-message ack/nack and dead-letter semantics, which fits a competing-consumer queue that feeds a human approval desk. Kafka gives us a replayable log with per-partition ordering and offset retention, which fits training and backfill use cases. Using a single broker for both would mean giving up one of those properties, so we kept them separate.
Do I need Spark or Databricks to build the Medallion side of this?
No. Bronze/Silver/Gold is a staging discipline — raw, then validated, then aggregated — not a specific platform requirement. We built our lakehouse layer in Rust on Apache Arrow and Polars. That let us avoid running a JVM cluster for what’s fundamentally atomic Parquet writes and a lazy group-by. If you want to see this layering as actual code, rust-polars-micro-lakehouse is a reference implementation of the same pattern — atomic Bronze writes on a POSIX filesystem, schema-validated Silver, lazy Gold rollups. It has no cloud dependency and no cluster to operate.
Why not just trust the LLM’s output directly? It explains its reasoning.
An explanation that sounds reasonable isn’t the same as a decision that’s correct, and prompting doesn’t reliably close that gap. The firewall doesn’t evaluate the model’s reasoning. It enforces fixed bounds regardless of what the model proposed: capacity limits, a budget ceiling, and a rule that blocks auto-approval for a genuine stockout. Explainability is useful for the human reviewing a proposal. It isn’t what determines whether that proposal is eligible for automatic approval in the first place.
What actually happens if my CDC connector is down for three days?
It depends on whether you configured a retention cap. Without max_slot_wal_keep_size set, the slot keeps retaining WAL for the entire time the connector stays disconnected. Three days of retained WAL on a busy table can be enough to exhaust disk space and force Postgres into an emergency, storage-constrained state. That’s usually the bigger risk — more than the staleness of the data itself.
If you set a cap, Postgres will have invalidated the slot at some point during those three days. That protects the host, but it leaves the connector’s stored offset unusable. Either way, recovery means dropping the slot, recreating it, and re-snapshotting the affected tables — there’s no path where it just catches back up on its own. This is why we monitor pg_replication_slots continuously instead of checking it only after an incident.
I queried my ClickHouse table and got duplicate rows for the same key. Is ReplacingMergeTree broken?
No — this is documented, if not always intuitive, behavior. Deduplication happens during an asynchronous background merge, not on insert, so two versions of the same row can coexist until that merge runs. SELECT ... FINAL forces deduplication at query time and costs more. Aggregating with argMax(column, version) runs faster, and it’s what we use for anything dashboard-facing.
tally · session — claude no longer reports limits on the free plan extra usage — —